How We’re Taking Species Mapping to the Next Level
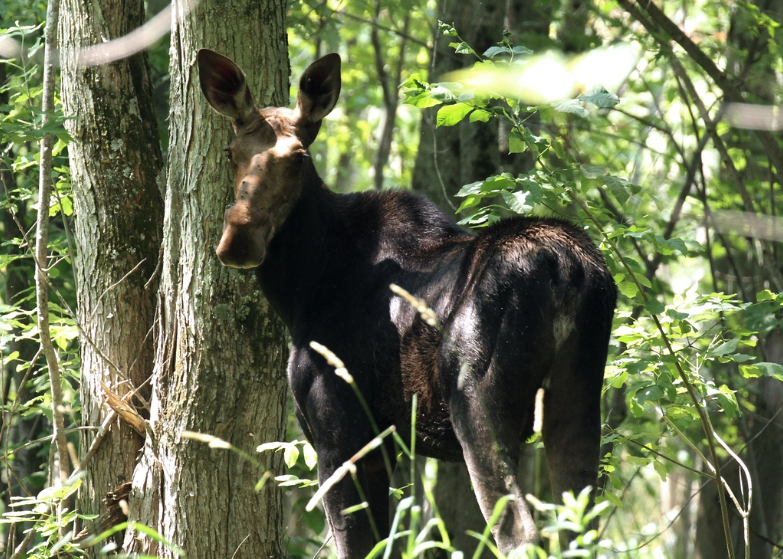
Moose, Alces alces, iNaturalist © Julie Filiberti
By Brian Kron
It’s a source of frustration to me that since moving to New England last year and joining VCE as a postdoctoral researcher, I have yet to see a Moose. That might be because of the population decline of Alces alces since 2011, driven by an increase in Winter Tick infestations and Brainworm.
But what if I could look up exactly where a Moose has been found across Vermont and where it’s likely to be found in the future, then use that information to locate one? More importantly, what if land stewards could access that information to create habitat conservation and restoration plans?
VCE Data Scientist Mike Hallworth and I are helping them do just that by using species distribution models (SDMs), which are based on observations submitted to the Vermont Atlas of Life by community scientists, in combination with environmental data collected by satellites.
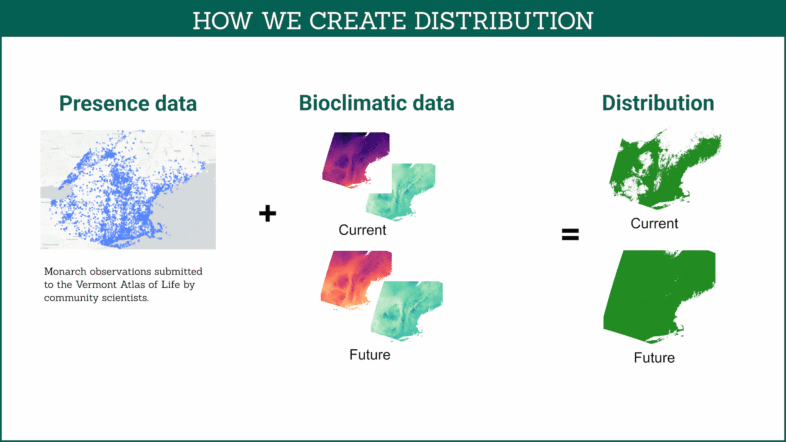
To understand how SDMs work, imagine a stack of papers. Each piece of paper represents a variable collected by satellite—one that might impact where a species is found and what habitat it can use—such as temperature, precipitation, the amount of forest canopy, or ambient light. On top of this stack, we put a sheet of paper with dots that represent where Moose have been recorded. SDMs put a pin through each Moose sighting and through all the papers in the stack at that location. At each pin, the model identifies the value of each of our environmental variables—that is, which factors most likely explain the Moose’s location.
The model then estimates the probability of a Moose’s presence at every location across Vermont, using the factors that are most likely to be important to Moose. If, for example, we find Moose mostly in wet forests, our SDM should identify that wet forest habitat is important to finding Moose and show us locations across Vermont where we are likely to encounter this north country icon!
When applied to many species, this tool will help biologists, conservation planners, and curious residents get to know which areas might harbor the most biodiversity, which areas and species need to be protected over the coming years, and which elements of the landscape we can focus on to help them flourish for decades to come. Models built from sightings and environmental data can help us prepare for changing conditions and land use, invasive species, wildlife diseases, and many other threats that may emerge in the coming years.
“Species distribution models allow us to better understand the factors that shape where species are found today and tomorrow, and this enables us to better conserve species into the future,” Hallworth says.
To strengthen the predictive power of this exciting tool, you can submit your observations of mammals, birds, fish, invertebrates—any living organism—to VCE’s iNaturalist project. Not only will you be improving the practice of conservation, you may also be helping a guy from Pennsylvania see his first Moose.