How Three Generations of VCE Scientists Work With Changing Ecology Data
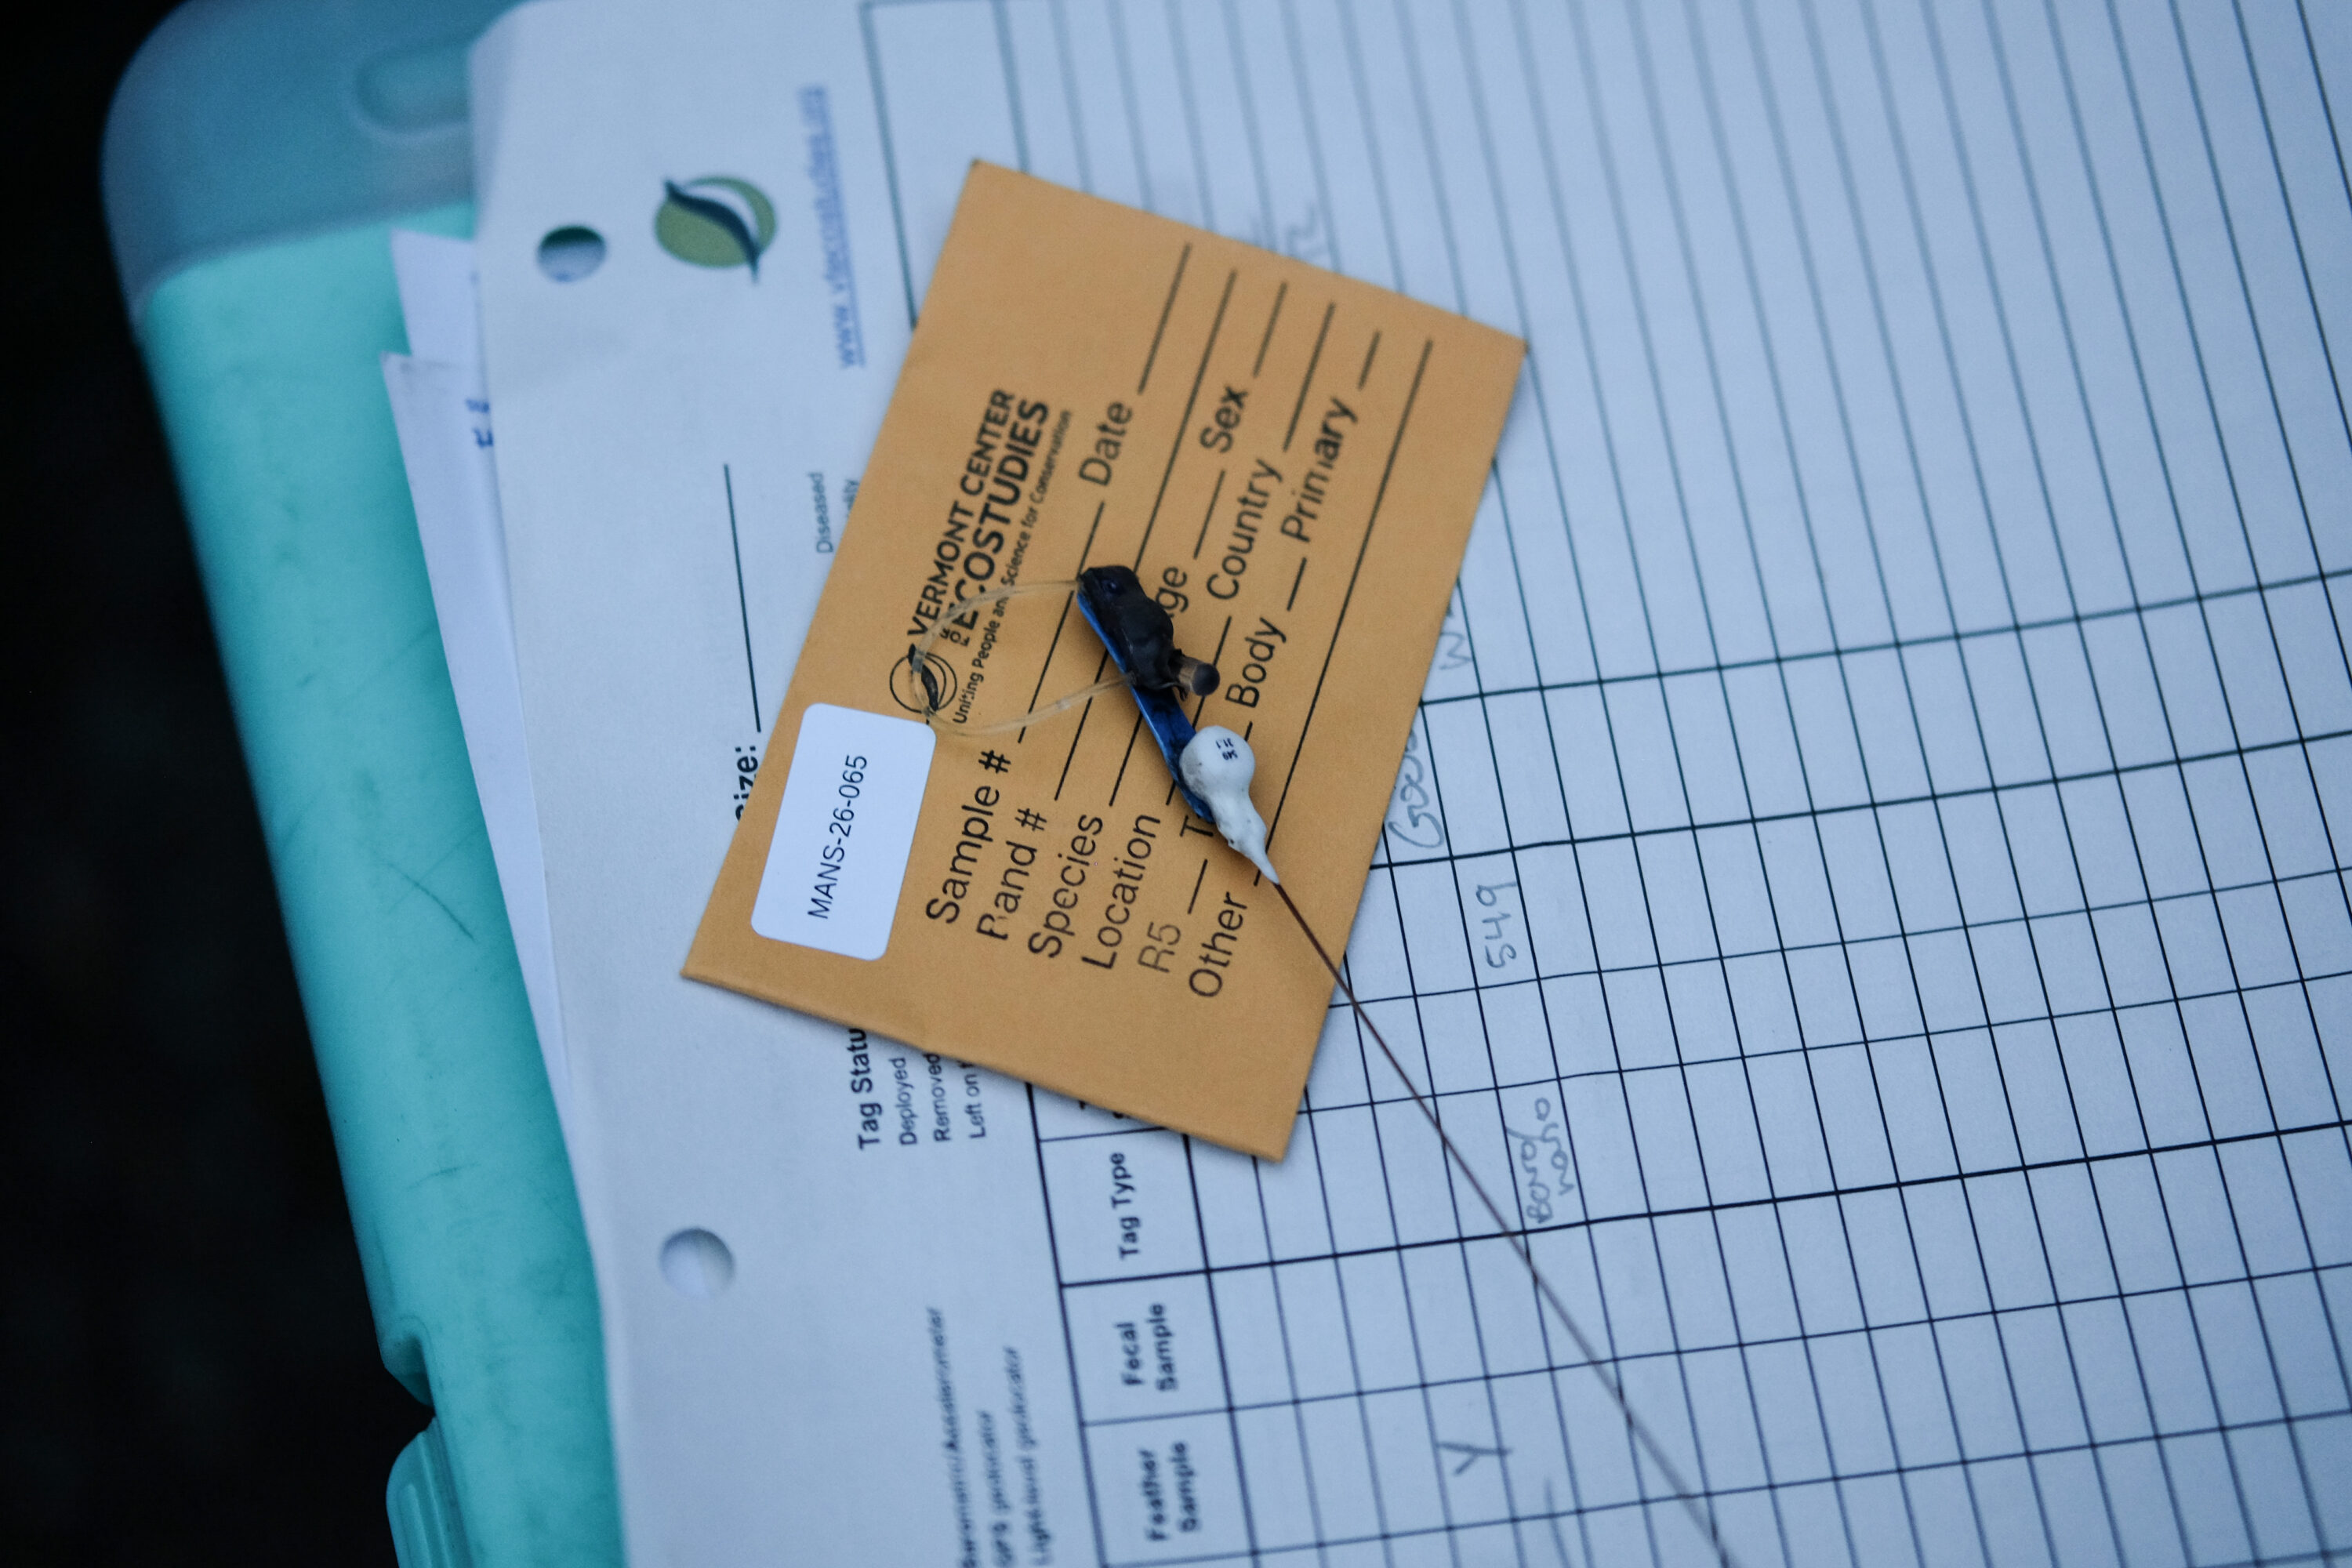
A tracking tag © Alden Wicker
This article is from VCE’s 2025 Annual Report. Read more about what we accomplished in 2025 at the Annual Report homepage!
Data gathering, managing, processing, and analysis has changed so much in the past 19 years, it’s almost unrecognizable. So we gathered three generations of our scientists in one room to talk about it. Kent McFarland is a conservation biologist, VCE co-founder, and founder of the Vermont Atlas of Life, an ambitious effort to document every species in the state of Vermont. Mike Hallworth is a data scientist and wildlife ecologist who uses cutting-edge migration technology, field research, and data analysis with sophisticated modeling techniques to understand animal movement at multiple spatial scales: from fine-scale habitat selection of individuals to intercontinental migrations of populations. Our newest addition to the team, Megan Massa, is VCE’s data manager, handling data cleaning, storage, and reporting pipelines. This conversation has been edited for length and clarity.
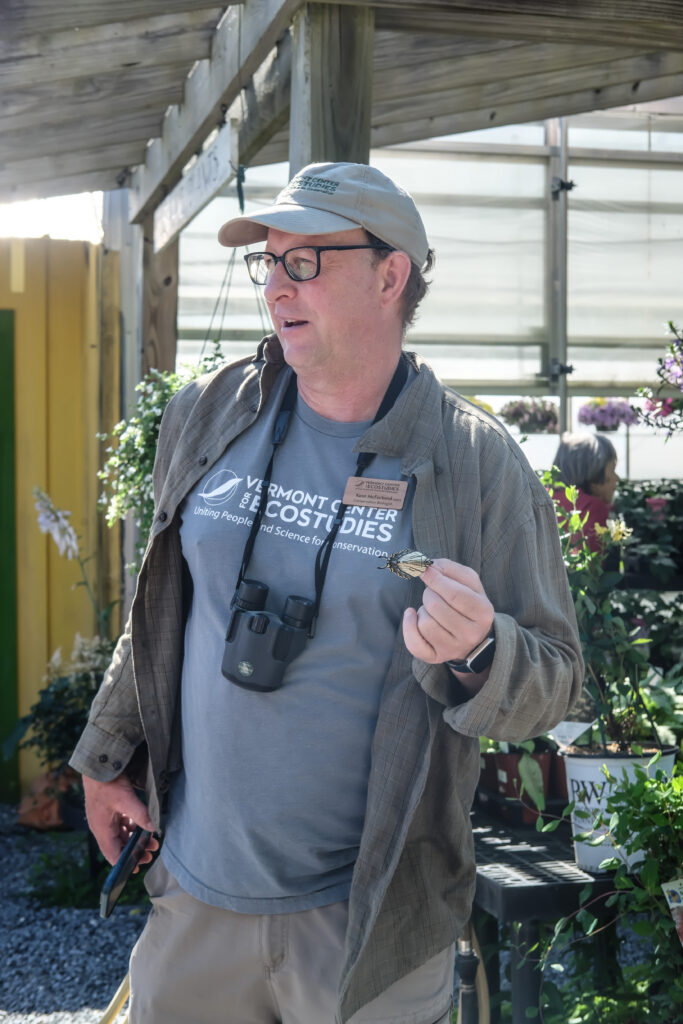
Kent McFarland speaks about butterflies on a VCE field trip © Alden Wicker
McFarland: Well, when I first started, we used to have to chisel it onto stone. That was the start of the Anthropocene. (Laughs) When I started in biology, the fancy thing was spreadsheets. In grad school, we used to have to type stuff into a comma-delimited file.
Massa: You still have them now. Like a CSV file, or really an Excel file. You have to type value, comma, value, comma.
McFarland: Nobody was using spreadsheets then.
Mike Hallworth: A little paper clip popped up, probably.
McFarland: Clippy? Oh yeah, the first thing you do is turn off that little bastard. (Everyone laughs) I don’t know what Chris [Rimmer] and Steve [Faccio, two other VCE founders] were doing with data, but it was’’t big data. In fact, some of those famous old ecology papers we learned about in school, based on very small datasets, have kind of been debunked. Very low computational power, very natural-history oriented, for better or worse—observational, not experimental.
Massa: The size and also statistical methods have changed a lot, like night and day. Those early studies were using pretty simple statistical methods and usually had a pretty straightforward experimental setup. A lot of that very foundational research turns out to be, by the methods we use today, not something that would be supported. Or definitely not as clear of a narrative as it seemed at the time
McFarland: It is easy for us to say that right now, looking back. But at the time, it was the best science available. So we’re still standing on the
shoulders of giants. Fifty years from now, they’ll probably look back at some of the stuff we’re doing and be like, that was ridiculous!
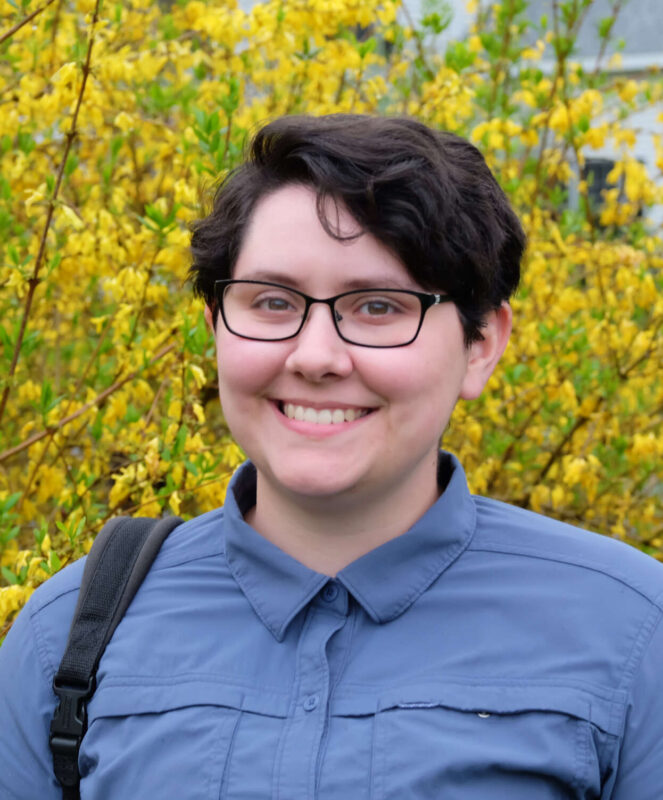
Megan Mass © Alden Wicker
Massa: Frequentist statistics? p-values??
Hallworth: They didn’t have the tool set that’s available today to ask really complex questions.
McFarland: It’s more complicated now because the subject is complicated. I mean, ecology is harder than rocket science. The more we’re able to do, the more we realize what we don’t know.
Take the Bicknell’s Thrush as an example, since we’ve been studying it for so long. In 1993, the bands were noted down on paper, and they were reported to the banding lab. In 1994 and 1995, we started putting those bands and data we were collecting on a spreadsheet. So now we could actually look at them, make a little graph about what’s going on. Not too long after, we were collecting nest-site stuff, and banding data, and vegetation data, and all of a sudden, spreadsheets don’t work. There’s too much, and there are too many mistakes happening. And so we started using a relational database. It’s a spreadsheet that’s related to another spreadsheet by an ID number. So if a female has a band number, like your Social Security number, that band number is on every spreadsheet so you can link all the data together. This female was caught five times, and she had three nests, and her nests were all successful in every other year. And we can start to look at patterns across all those different things. In the early 2000s, we realized we can use Mark-recapture statistics in these new programs. We had the computational power.
Massa: Mark-recapture statistics are: If you put a band or a tag on a bird and you never see it again, that could mean that the bird is dead, or it could mean that it just left your study area, and you didn’t happen to encounter it again. If you get enough birds, especially at one place over time like on Mount Mansfield, you can start to use these models in a program that is doing much more complicated statistics than you can do on the back of the envelope. You can find out things like: What are the odds you’ll recapture a bird? And what does that mean about the population size or survival rates?
McFarland: We could start to do things like, oh, what’s the survivorship rate of males versus females? Because we could link all that data together.
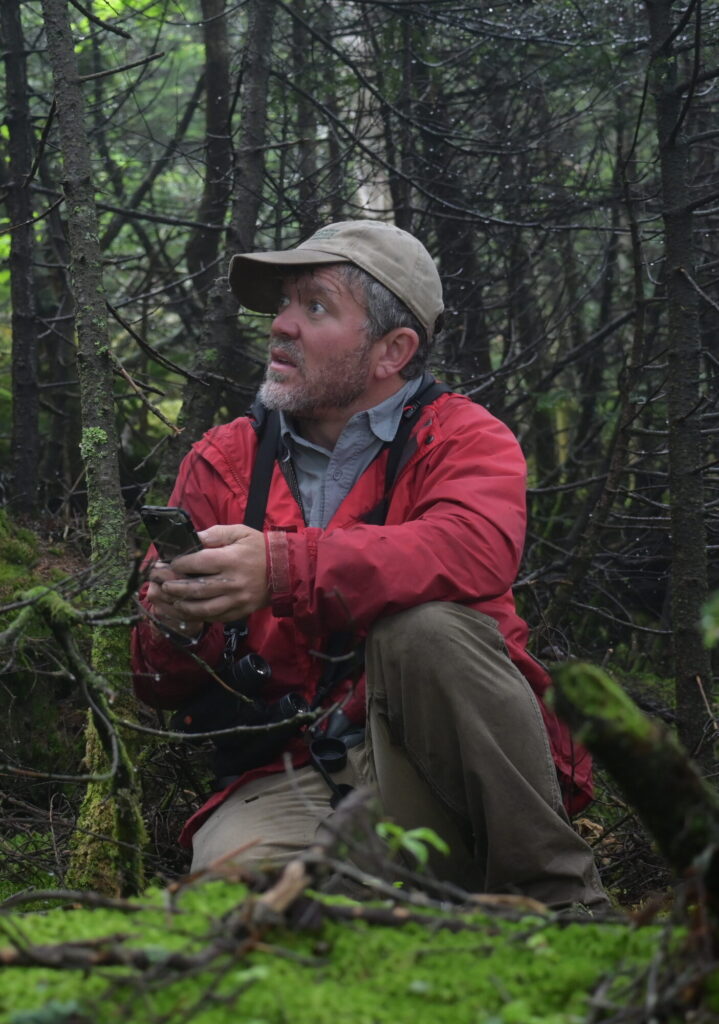
Mike Hallworth working on Mount Mansfield © Alden Wicker
Hallworth: The things you can know about parts of the world that you’re not currently standing in is something that’s definitely changed in the past 35 to 40 years. When I started, we had bird banding to link populations across the annual cycle, and then the huge advance was using chemical signatures of feathers: stable isotopes.
McFarland: We could say, oh they mixed together in the wintering grounds from different breeding grounds. You could easily have a bird from Quebec with a bird from the Catskill Mountains spending the winter together in the same piece of habitat in the Dominican Republic.
Massa: Which tells you something about conservation. Because even if they disperse to different breeding grounds, they’re all vulnerable at the same point in the year, which is their habitat in the Caribbean.
Hallworth: The next thing was light-level geolocators.
McFarland: We started figuring out that they don’t migrate until October, and it looks like they stop over somewhere on their way down to the Dominican Republic. At the same time, we were using Mark-recapture to figure out that females might be our most in-trouble group. But we didn’t know where they were having trouble in their annual cycle.
Hallworth: And now we’re using technology on small birds that can show with 10-meter resolution where that bird was across its full annual cycle. We can take those capture histories, they’re called, integrate all those data from Mount Mansfield with the tracking data that we’re using, and now with remote-sensing products, like satellite imagery of the world, we can integrate all those things to make predictions and estimates about how the world is changing and how it’s affecting populations across their annual cycle. That wouldn’t have been possible 15 or 20 years ago.
McFarland: You know, we get excited about modeling things. But part of it is you have to have good data. The other big thing that’s happened over the last 20 years or so is data standards and paying attention to metadata—data about the data—so you understand what the data are for. I have data on this laptop that I collected. I go back and I look at it, and I’m like, who the hell did this? I forget how I did it. I have no idea what half of it means anymore. We didn’t even talk about metadata back then. We just thought, oh, we’ll remember. Well, I don’t remember. Data is really valuable until it’s not because you don’t understand it anymore.
Now we have—with the Vermont Atlas of Life and other things—metadata standards, like Darwin Core. They’re worldwide, agreed-upon standards. Even here in the office, we have our standards so that 20 years from now, when someone like me is long gone, someone should be able to look at that dataset and be like, Oh, I can totally recreate this thing.
Hallworth: There has been a paradigm shift from back in the day when you were collecting data for yourself to answer questions, and now collecting data so that it can be used by you and other people. Now, as we collect data, we think: What’s going to happen 10 years from now, or who else can use these data?
McFarland: Even back in 2007, one of our core beliefs at VCE was open data—making your data available for others to see and use. Now everyone is about open data when it comes to ecology. Open data doesn’t mean you have to give it to anyone, but when you’re done with it, or sooner, it should be a resource for the world.
Hallworth: The climate versus habitat paper [“Does habitat or climate change drive species range shifts?,”] is a good example. We know that spruce-fir habitats are actually moving downslope, counterintuitively. At the same time, climate change is also having the opposite effect, where conditions should be getting better upslope for a cold-tolerant species. We used long-term data from point counts that were initiated years and years ago going back to the earliest days of Mountain Birdwatch, and it involved a lot of these statistical models that we were talking about that account for imperfect detection. We used a lot of remote-sensing data to look at where Red Squirrels are throughout the year and what might be limiting their range. And then we used more modeling to tease apart the direct and indirect effects of temperature and precipitation to see what determines where Red Squirrels are on the landscape. That would not have been possible even 15 years ago, because of computing power, resolution of remote-sensing data, and even some of the statistical methods we used in that paper that were not worked out yet.
McFarland: So what was the answer? (Everyone laughs)
Hallworth: It’s complicated, but they seem to be following the habitat [rather than the climate conditions].
McFarland: Now we have more complicated questions.
Hallworth: In the 1950s you had to design an experiment that was easy because you were hand-typing it, and you were using a typewriter, and you were calculating things on a calculator. Versus now, you name it. There’s no limit on the questions you can ask or the data you can get your hands on.
Massa: The question really is so fundamental. For my master’s degree, they had this big dataset. You could do basically anything you want with this. So what are you interested in, and what do you think will be useful? In my case, it was: What do land managers want to know that we could answer with this dataset? It still exists, you could do a lot more stuff with it, but I ended up pursuing the questions that sounded relevant to managers.
You can model what an effect might be of a certain action, but ultimately, we never have 100% understanding of any system. And so making decisions—especially value decisions about where money should be spent and why—is still, ultimately, a people question. The models can tell you some things, but they can’t tell you what you value or where to direct your conservation resources.
Hallworth: As we come into the era of big data, there have been a lot of tools like iNaturalist that organize the data into summaries. People can ask questions, and they don’t necessarily have to be scientists. For example: How has the timing of this species migration changed? They can just look at some of the tools that combine the big data and say: It’s a week earlier now. I think the big-data transformation has been that the lay person can glean some information from it without being trained to do statistical modeling or data analysis.
Massa: We haven’t talked about GIS technology. The ability to look at the location records and scroll around and have all these satellite layers and zoom in and look at all of the points on the map and the data associated with them—that’s fairly new, especially on a large scale. You could not have done that 20 years ago unless you had a really, really fancy computer.
McFarland: When VCE started [in 2007], we had a workstation, and that’s where we went to do our GIS work. The first time I did a model for the winter grounds for Bicknell’s, around 2015, I think it took me two days to run. Now you could run that model and it probably would take 10 minutes.
Hallworth: Things change a lot. Wow.
Massa: I think in this field in particular, the phrase “artificial intelligence” is loaded. Machine learning models have been used for a fairly long time. That just means you train a model based on data, and it “learns” through whatever statistical method that model relies on, and then you feed it new data, and it processes based on rules that it has learned from that processing training step. That’s pretty widely used, and I think it will continue to be. I think artificial intelligence—like Google, Gemini, Claude, ChatGPT—has less of a direct utility for the actual research itself and more on things surrounding it. A large language model can do things like edit text or brainstorm.
McFarland: I think it’s moving so fast that there will be a time soon when you will be able to feed it a whole set of data, and it will help you write code and figure out how you want to model it. You’ll still have to be able to read the code to make sure it’s not making a mistake on the code. There’s always going to be someone driving the ship, but it might be faster.
Hallworth: Someone has to come up with a question that needs to be answered.
McFarland: You still have to be a biologist.