Peculiar Patterns: Turning Data into Predictive Maps
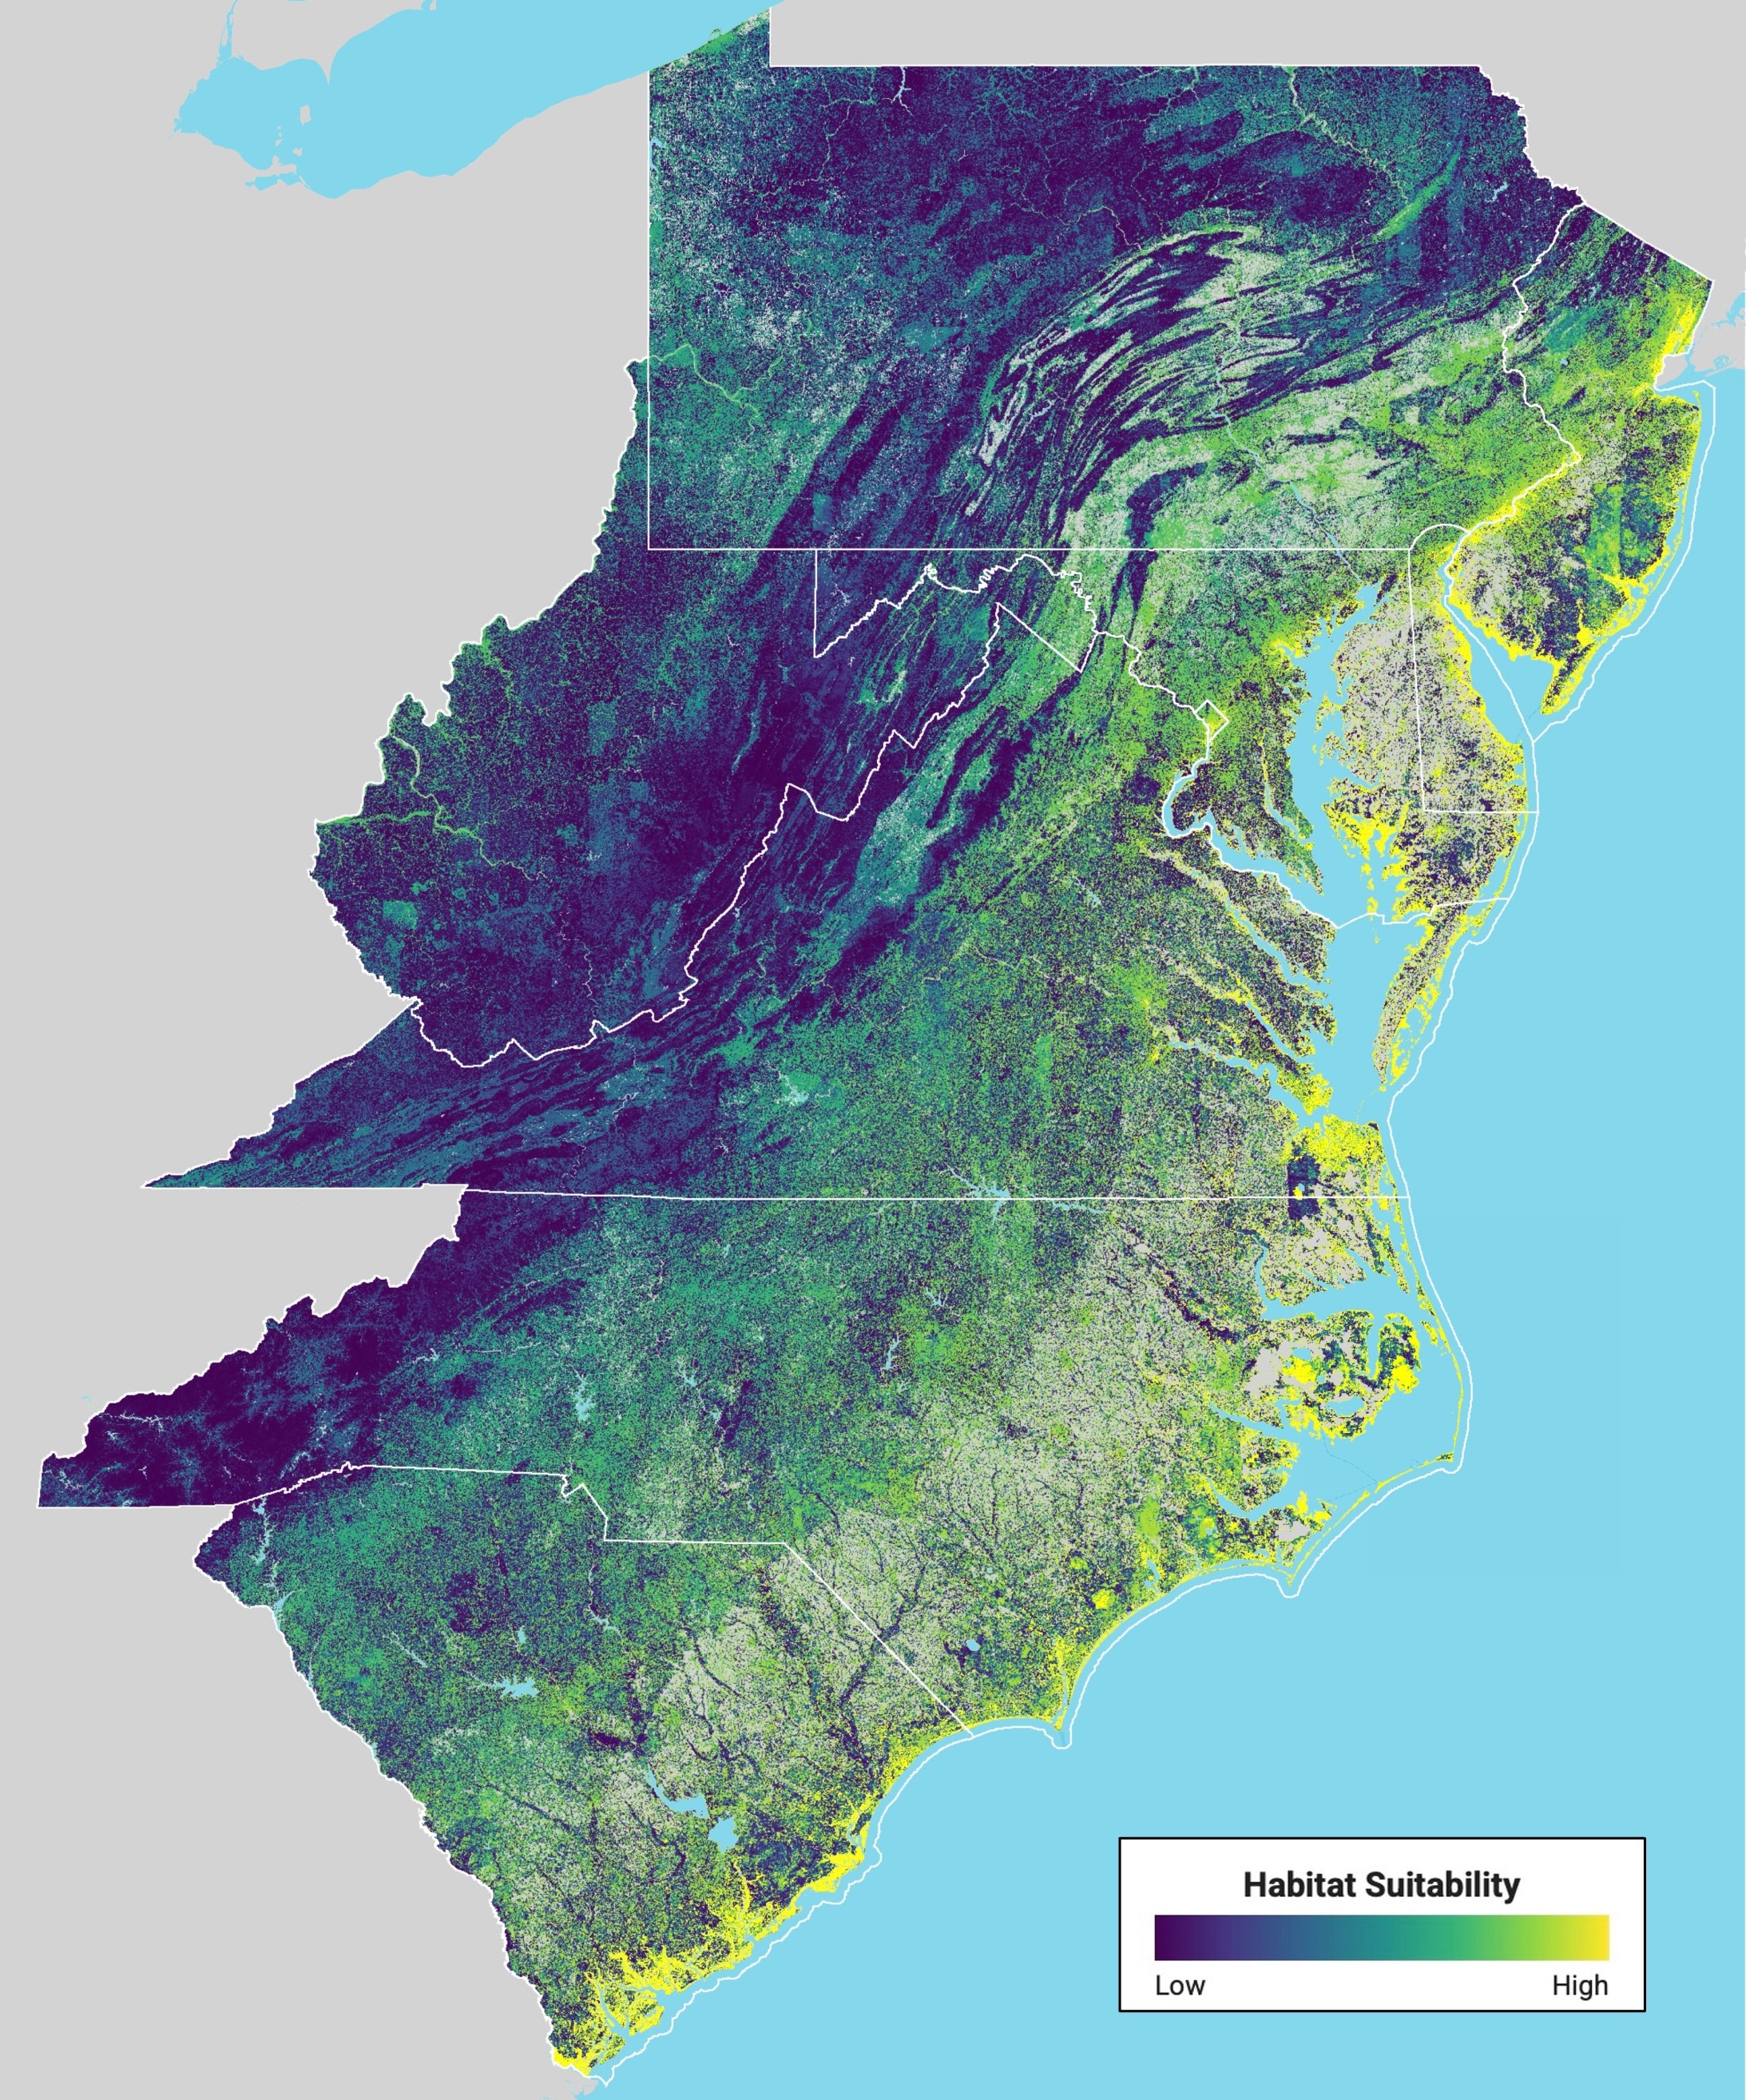
A map of habitat suitability for migrating Bicknell’s Thrushes that ranges from Pennsylvania to South Carolina.
By Rowan Thomas, a 2026 VCE summer intern mentored by VCE Data Scientist Michael Hallworth.
I understand why many at the VCE call my desk “The Basement.” While my fellow interns are off on grand adventures—paddling across lakes throughout the state in search of elusive nesting loons or following the trail of the Bicknell’s Thrush to the misty, golden-washed mornings of Mount Mansfield—I remain tucked into the back corner of the VCE office, listening to the constant droning of the building’s AC unit.
My role as the VCE’s Spatial Intern has certainly not matched the glamorized, fieldwork-centered image of an ecologist that I had often been fed. Sometimes, I hear the chatter of VCE staff and other interns in the field lab a few doors down, conjuring scientific names of various bee species as they are identified, discussing the breeding timelines of birds caught during their recent banding trip to Mansfield, or throwing around abbreviations for field sites they are planning to visit next. It sounds like an entirely different language to me, and I can’t help but wonder what kind of ecologist I am if I can’t understand them.
I often feel the allure of the outdoors. I glance outside, perhaps catching a glimpse of the Eastern Phoebe perched in the crabapple tree outside my window as it prepares to snatch a stray insect rising from the grass below. Other times, it feels like nature might be directly calling for me: an American Goldfinch landing on the window screen, attempting to peel off sections of the wiring for nesting material—or maybe instead intending to break in and pull me outside.
Yet, I simultaneously feel a strong yet mysterious pull to the world currently open on my computer screen—one not separate, but parallel, to the excitement outside. A notification flashes on my screen, indicating that, after hours of computational labor and weeks of my own trial and what felt like endless error, my model predictions have finally finished exporting.
My final product: a map of habitat suitability for migrating Bicknell’s Thrushes ranging from Pennsylvania to South Carolina. Areas of high predicted suitability along the coast are highlighted in a vibrant yellow, while deeper green and dark indigo shades mark the low suitability of the Appalachian Mountains, where the species rarely strays. I find an alluring beauty to the map, especially in how the colors ripple across the Pennsylvanian and Virginian Appalachians like water in the various hues washing across the landscape—an indication that elevation (and, by proxy, distance to the coast) is a key predictor in the model.
This model has been one of my main projects this summer, aimed at combining Bicknell’s Thrush observations with environmental data across the Mid-Atlantic to predict suitable stopover habitat during their southward migration to Hispaniola. Through this project, VCE hopes to identify locations for additional Motus towers on the East Coast that can pick up radio signals from tagged Bicknell’s Thrushes to track them as they migrate.
Beyond the aesthetic appeal, what attracts me to ecological modeling is how it helps reveal and explain the dimensions of the world that may remain obscured to the ground-level observer. Zooming into my prediction map more closely, I see a peculiar pattern: areas predicted by the model to be “suitable habitat” are aligned with cropland—not forest patches, as one might expect. Canopy height, or more specifically, both very low and very high canopy heights, are also important predictors of high suitability. Surprisingly, the more moderate canopy heights typical of forest patches are associated with low suitability in the model.
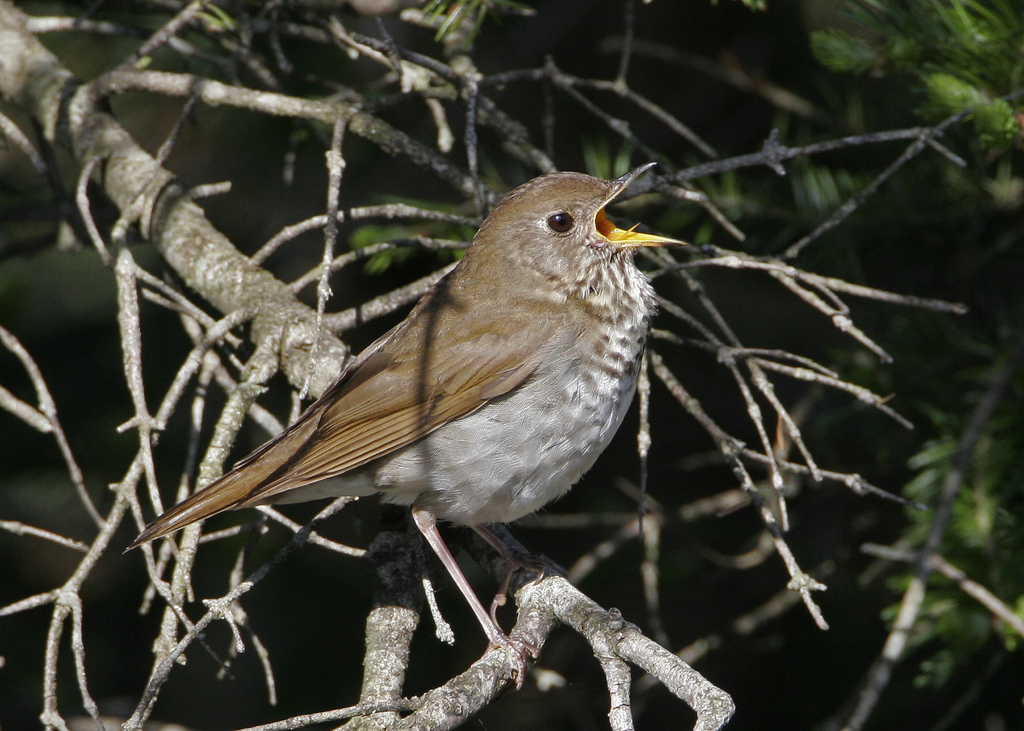
Bicknell’s Thrush © Larry Masters
This doesn’t necessarily indicate that this species occupies cropland, however. I think back to a common phrase in statistics usually attributed to George Box: “All models are wrong, but some are useful.” The impact of canopy height is particularly fascinating—and likely still important. After removing agricultural lands from the model output, large areas of high probability remain, including low-canopy wetlands, where fruiting plants may provide a great energy source during a Thrush’s difficult journey.
Alternatively, the importance of canopy height may just be an artifact of sampling. Areas of shorter canopies and less vegetation likely make Bicknell’s Thrushes more visible (and more likely to be observed), even if the environment is not the most suitable. But, as of right now, it is the best model that anyone has on stopover habitat for the species—and part of the reason why greater study of their migration is so important.
Maybe that uncertainty is a bit frustrating and anticlimactic. Yet, it is exactly what fascinates me. With every new model and unanswered question still comes more information and more leads to follow. Could I incorporate other forms of observation data? What other environmental variables can I add that might be ecologically important? How can I account for other sources of variation like annual weather patterns? Every question is another set of models, and perhaps, a step closer to determining where Bicknell’s Thrushes stop over during migration—and how we can best protect them.
Ecology would fall apart if we attempted to separate the fieldwork from the less glamorous, often frustrating side of data cleaning, analysis, and visualization. No analysis could ever be completed without data, while data means little if they are never analyzed. Despite this, when it came time to present my current prediction map to my peers, mentors, and other staff at VCE, I hesitated. I was surrounded by a group who knew infinitely more about both Bicknell’s Thrushes and migration—the same people who threw around terms in the lab I still couldn’t always follow.
It was the excitement that brightened their faces as they saw my project—a readable, actionable visualization of VCE’s own hard work—that melted away my reservations. At that moment, I realized what role I had begun to play: a translator, someone who can take the words and numbers of the scientist and bring them to life.
That excitement—and the joy of being able to inspire it—is addictive.